S. T. LanierThe Challenges of Gradient DescentHandling local minima and saddle points2 min read·Mar 29, 2021----
S. T. LanierBinary Search TreesI’ve recently written on the importance of buffing up on computer science fundamentals for anyone working in data science — it is, after…3 min read·Mar 15, 2021----
S. T. LanierWord EmbeddingsA quick implementation for adding complexity to language data3 min read·Mar 8, 2021----
S. T. LanierinThe StartupGet a Computer Science Education for FreeFor self-starters, bootcamp grads, and even experienced professionals4 min read·Mar 1, 2021----
S. T. LanierThe Many Types of Neural NetworksAn overview of the four archetypes of modern networks4 min read·Feb 22, 2021----
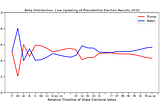
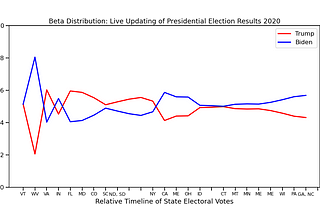
S. T. LanierinTowards Data ScienceBeta DistributionsEasy updating for fast live predictions4 min read·Feb 15, 2021----
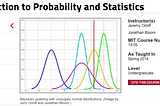
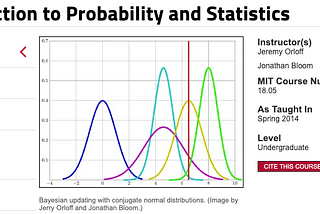
S. T. LanierinThe StartupMIT 18.05An excellent resource for core probability and statistics concepts3 min read·Feb 7, 2021----
S. T. LanierinTowards Data ScienceTalking About Missing DataThe vocabulary you’ll need for a technical interview5 min read·Jan 31, 2021----